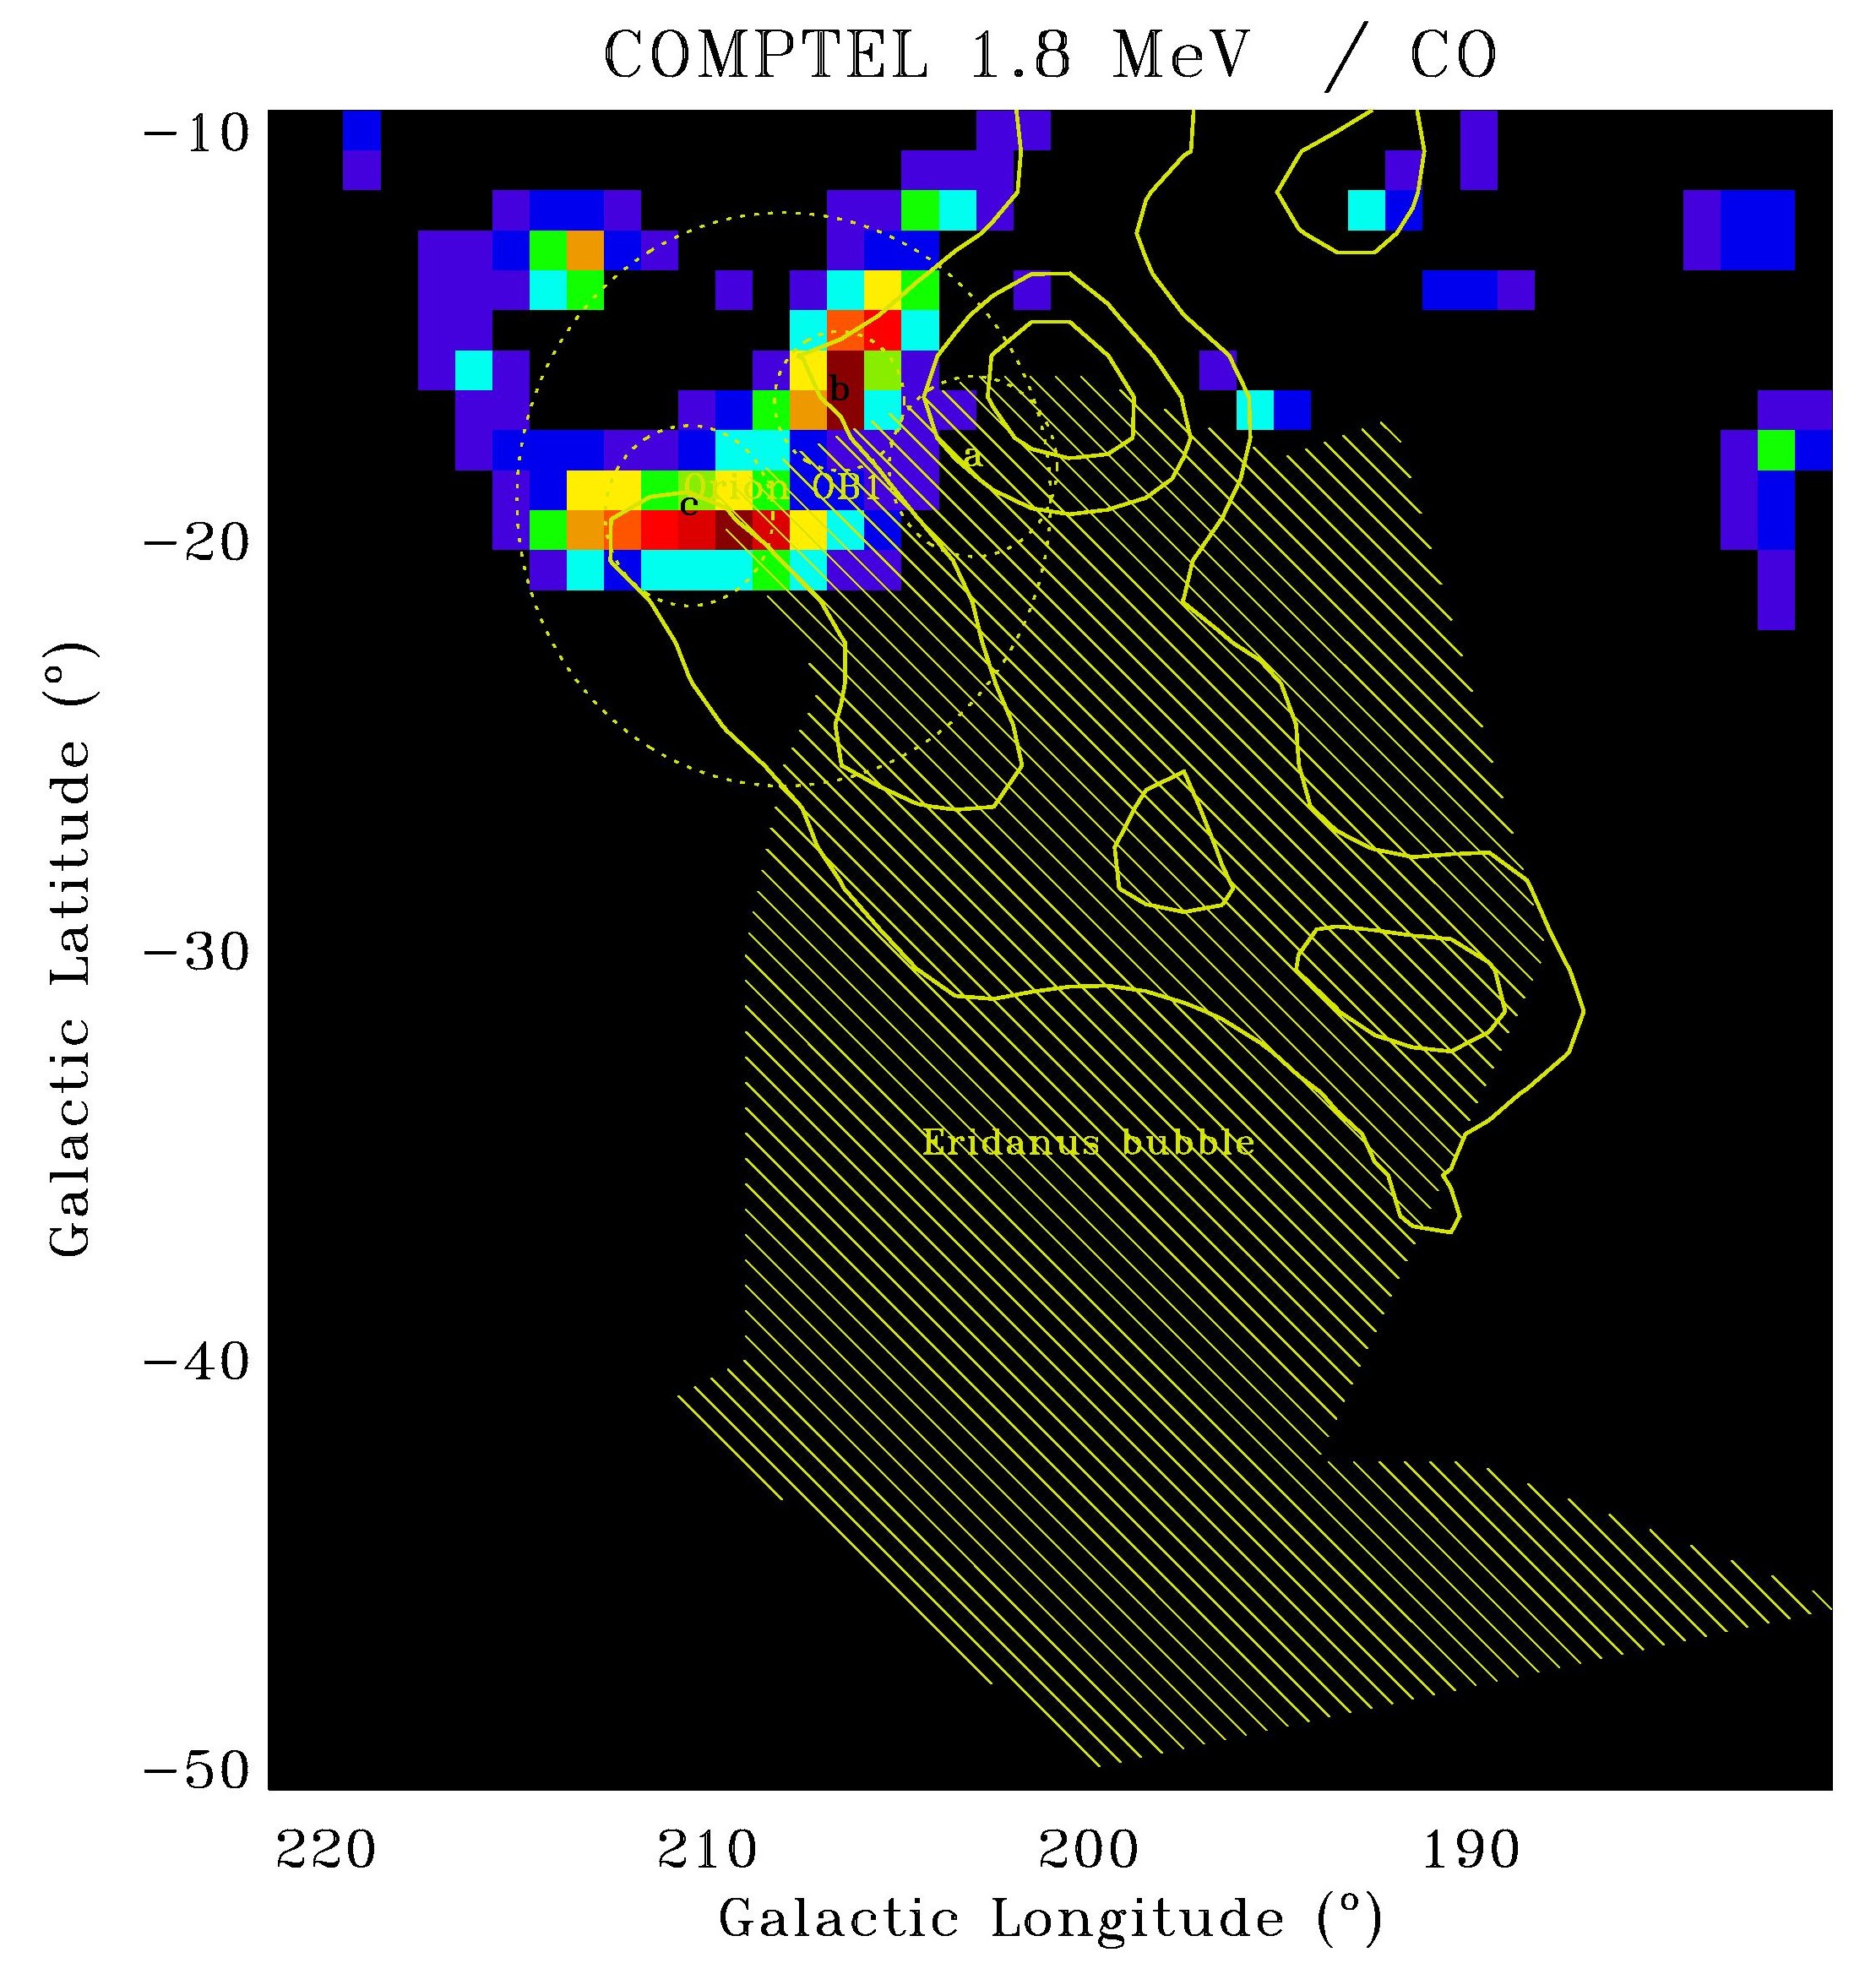
 Spectral and Intensity
Variations along the Plane of the Galaxy
Spectral and Intensity
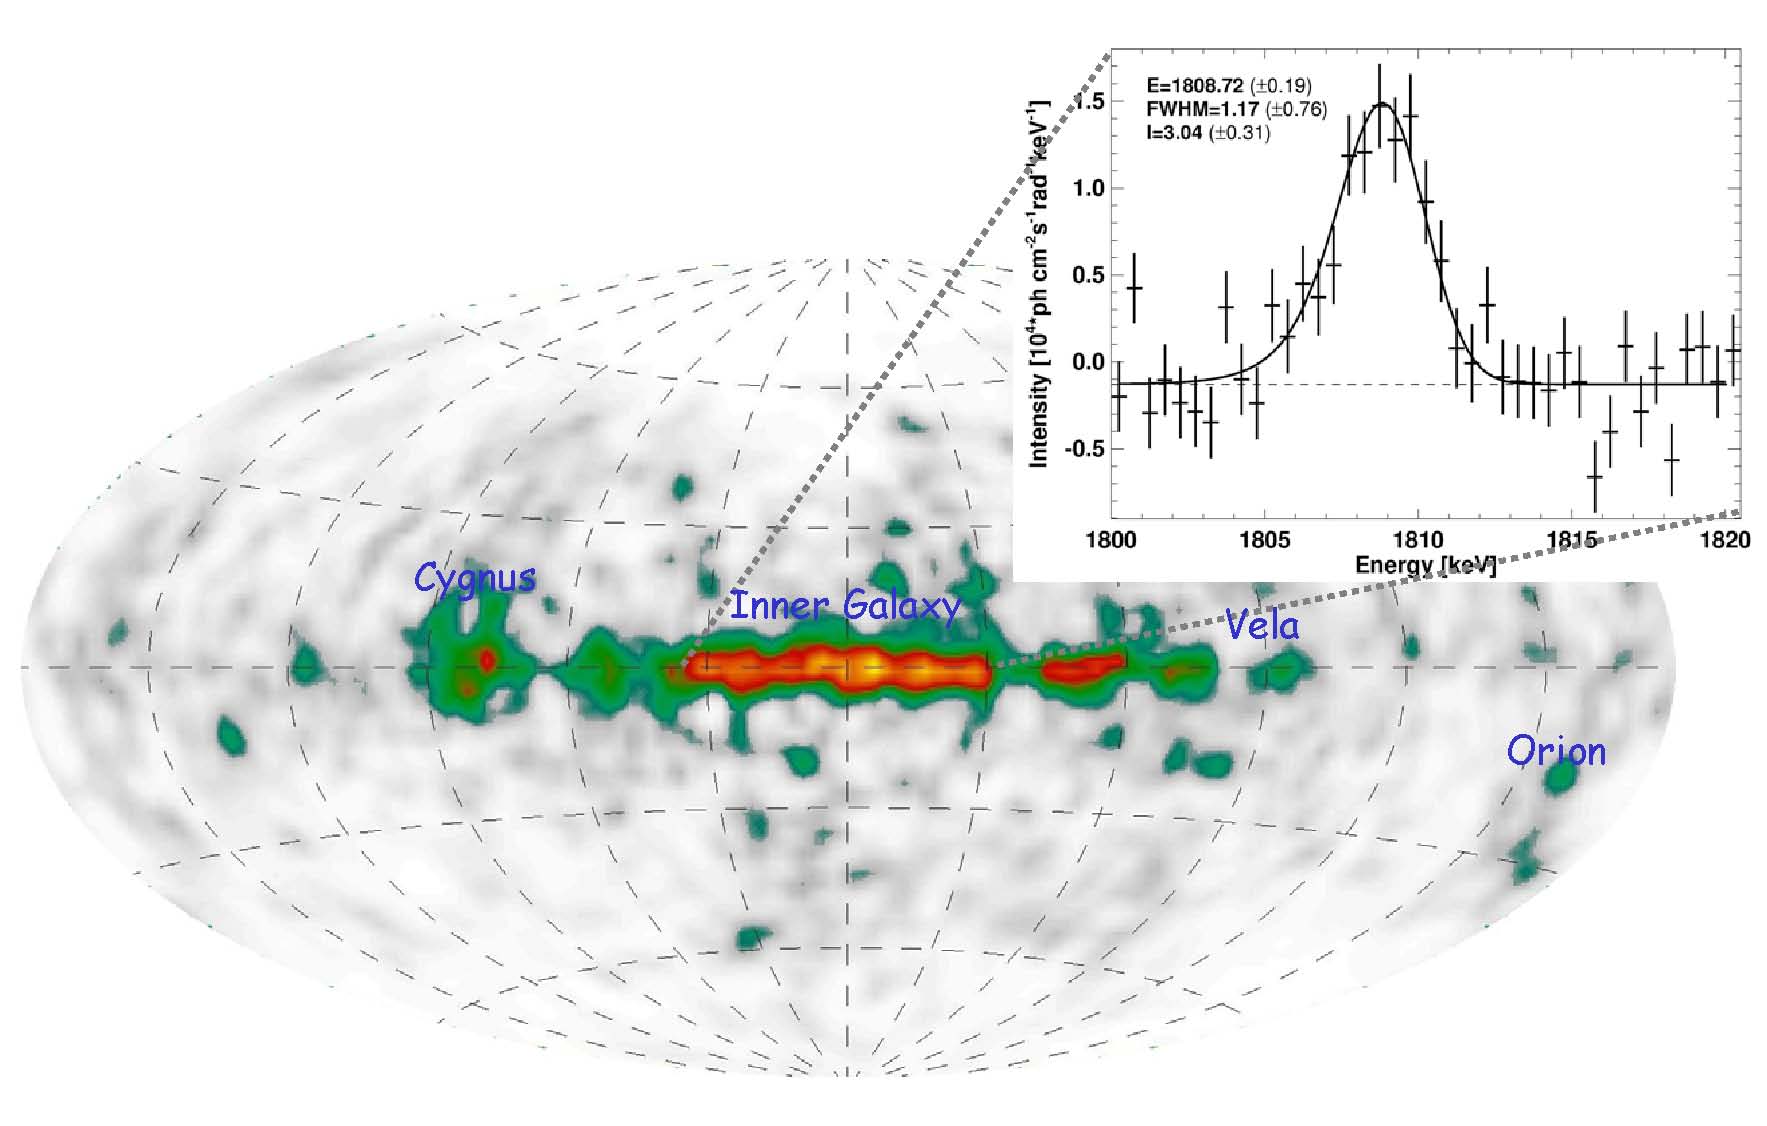
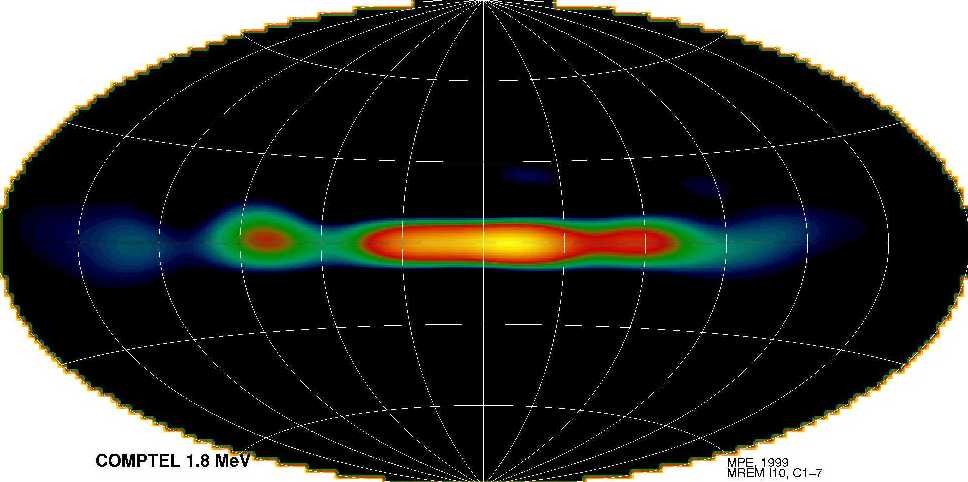
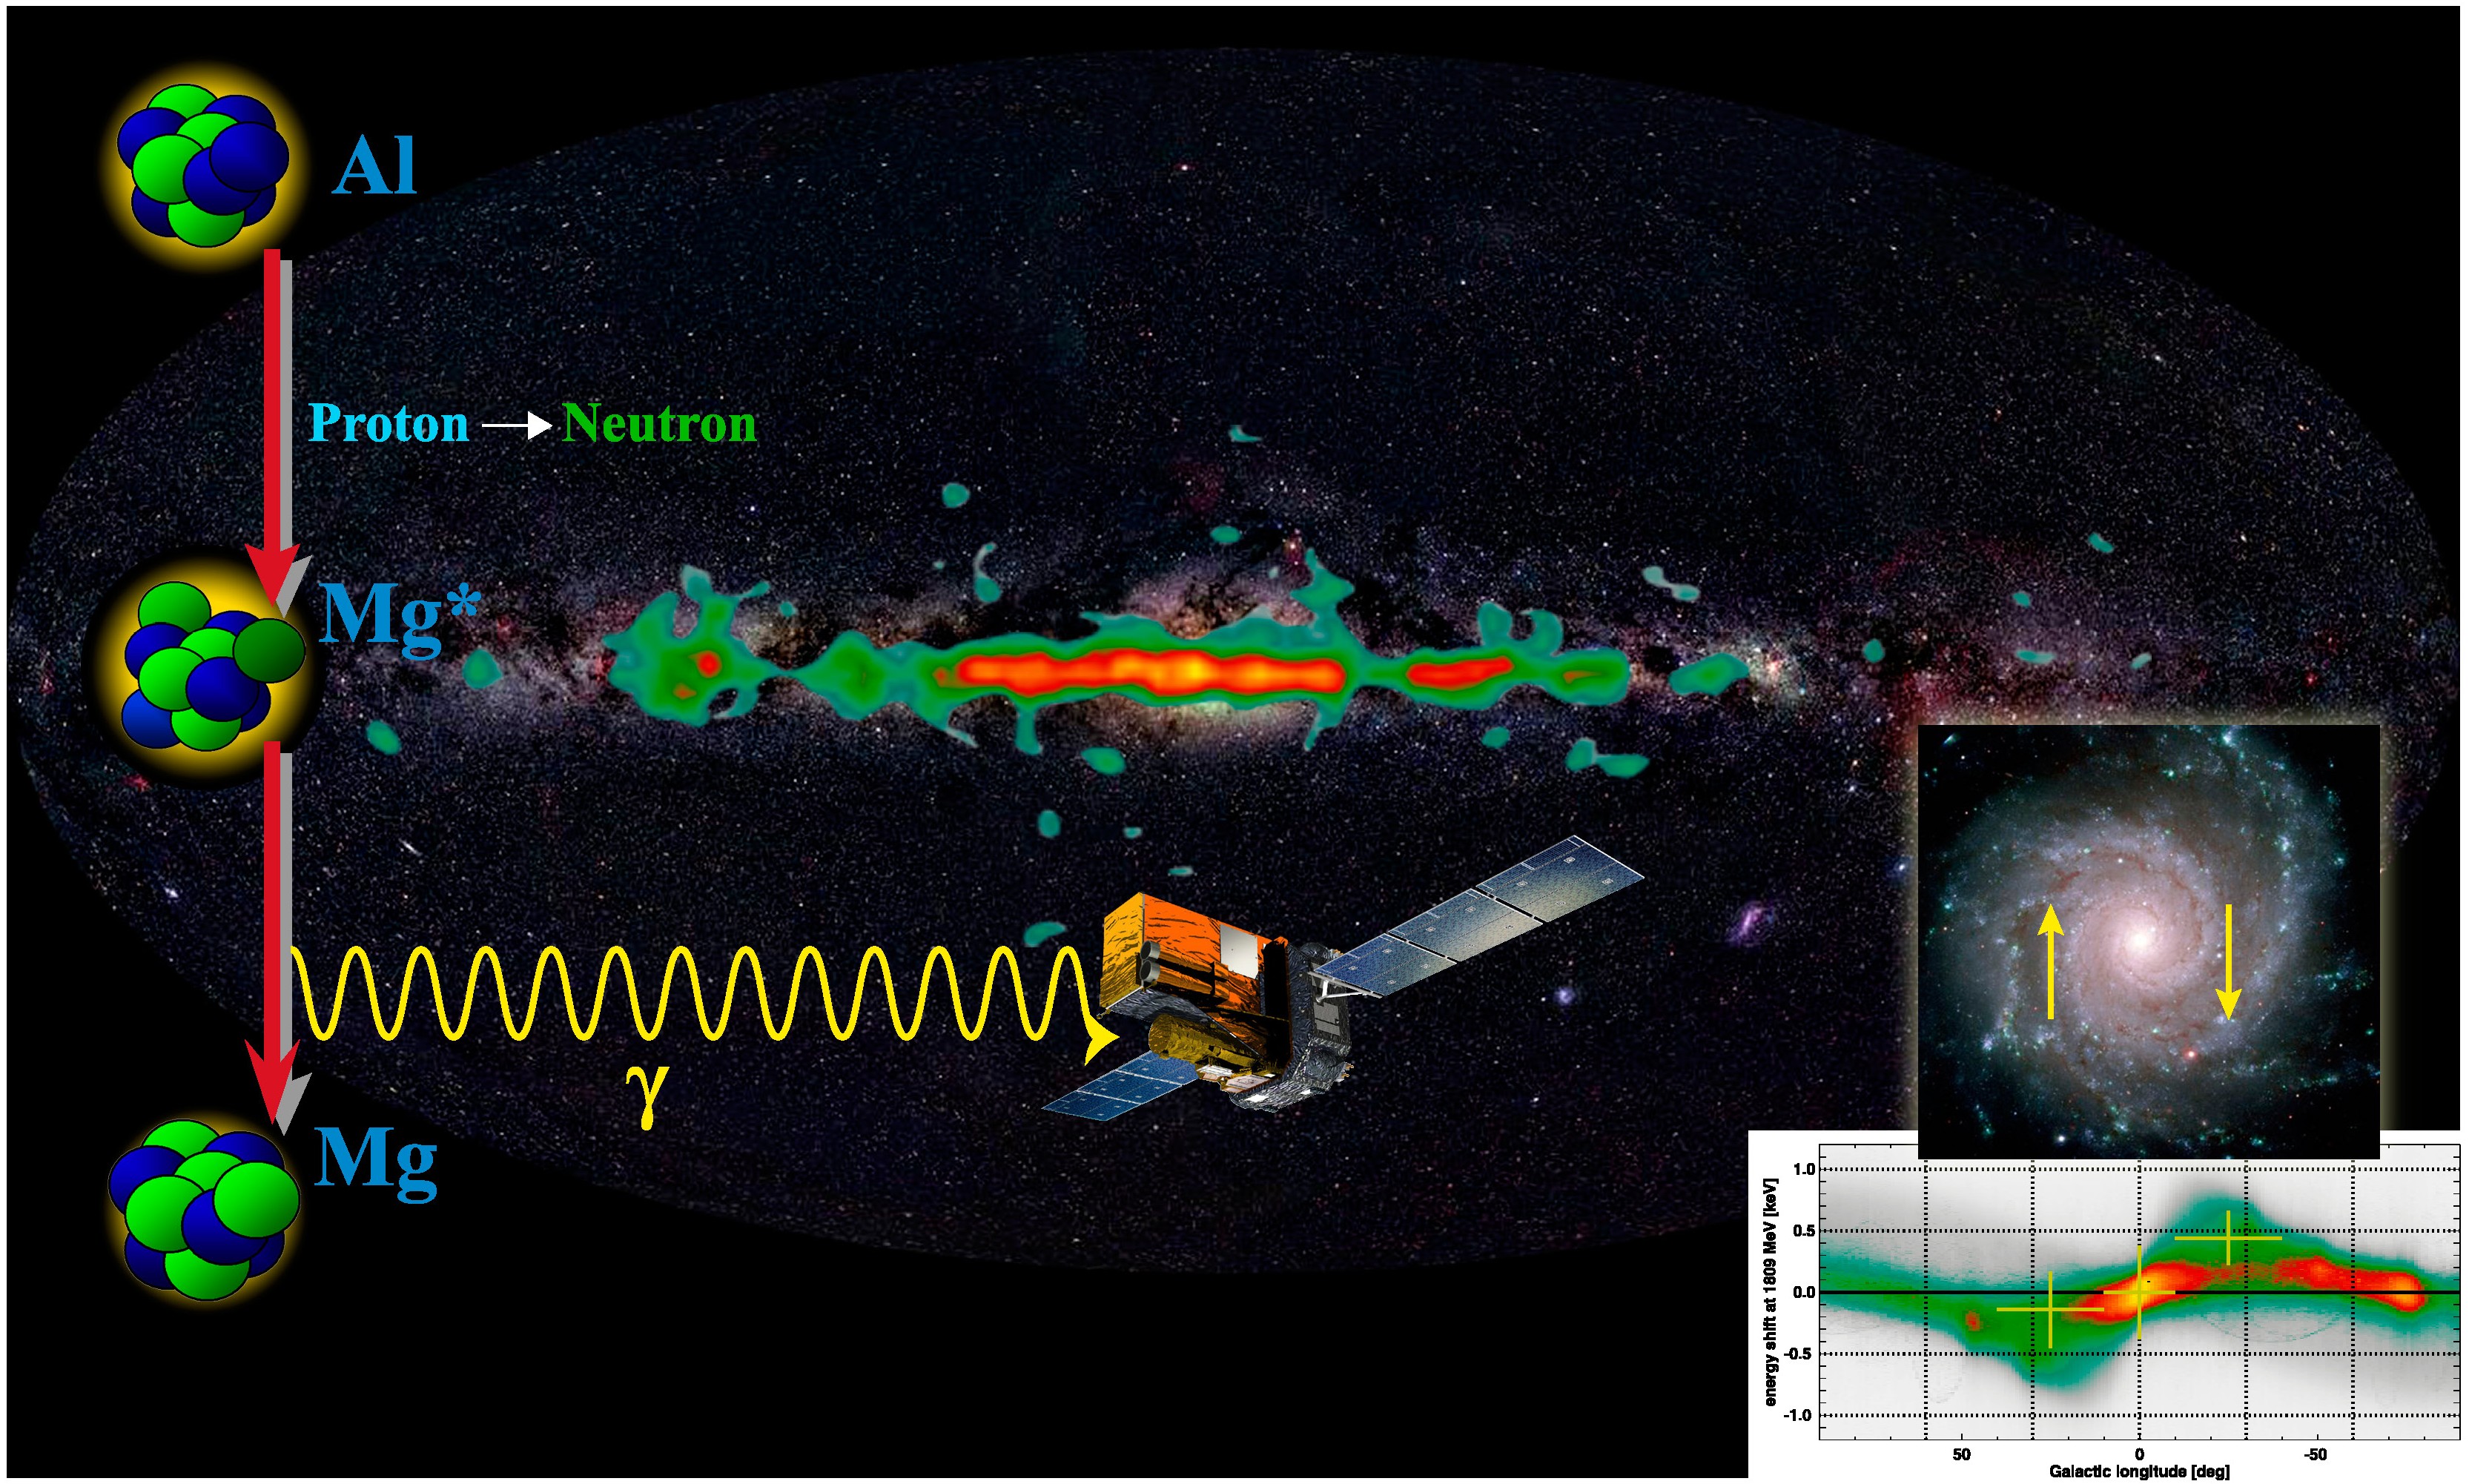
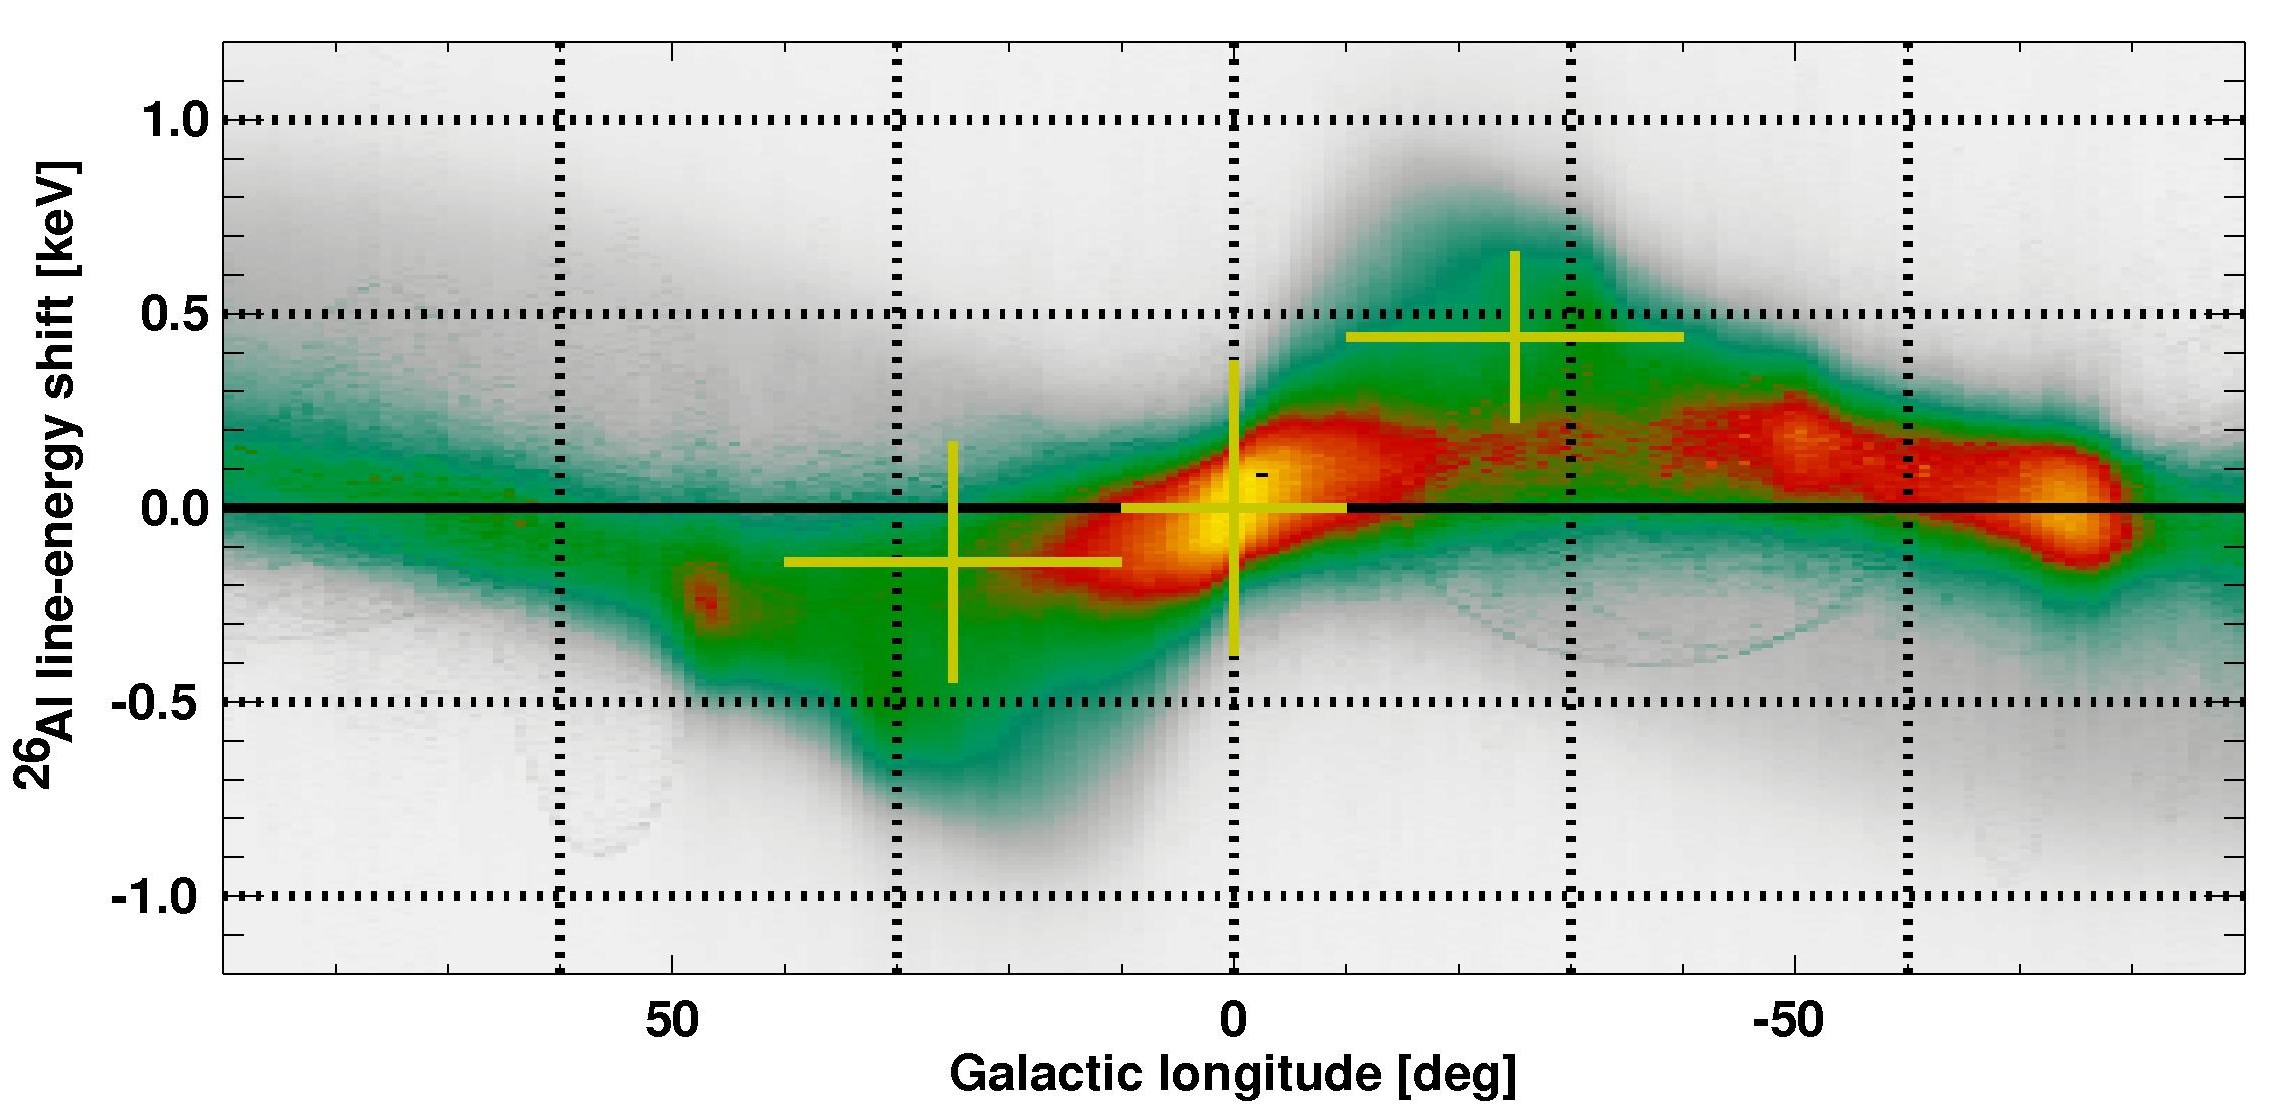
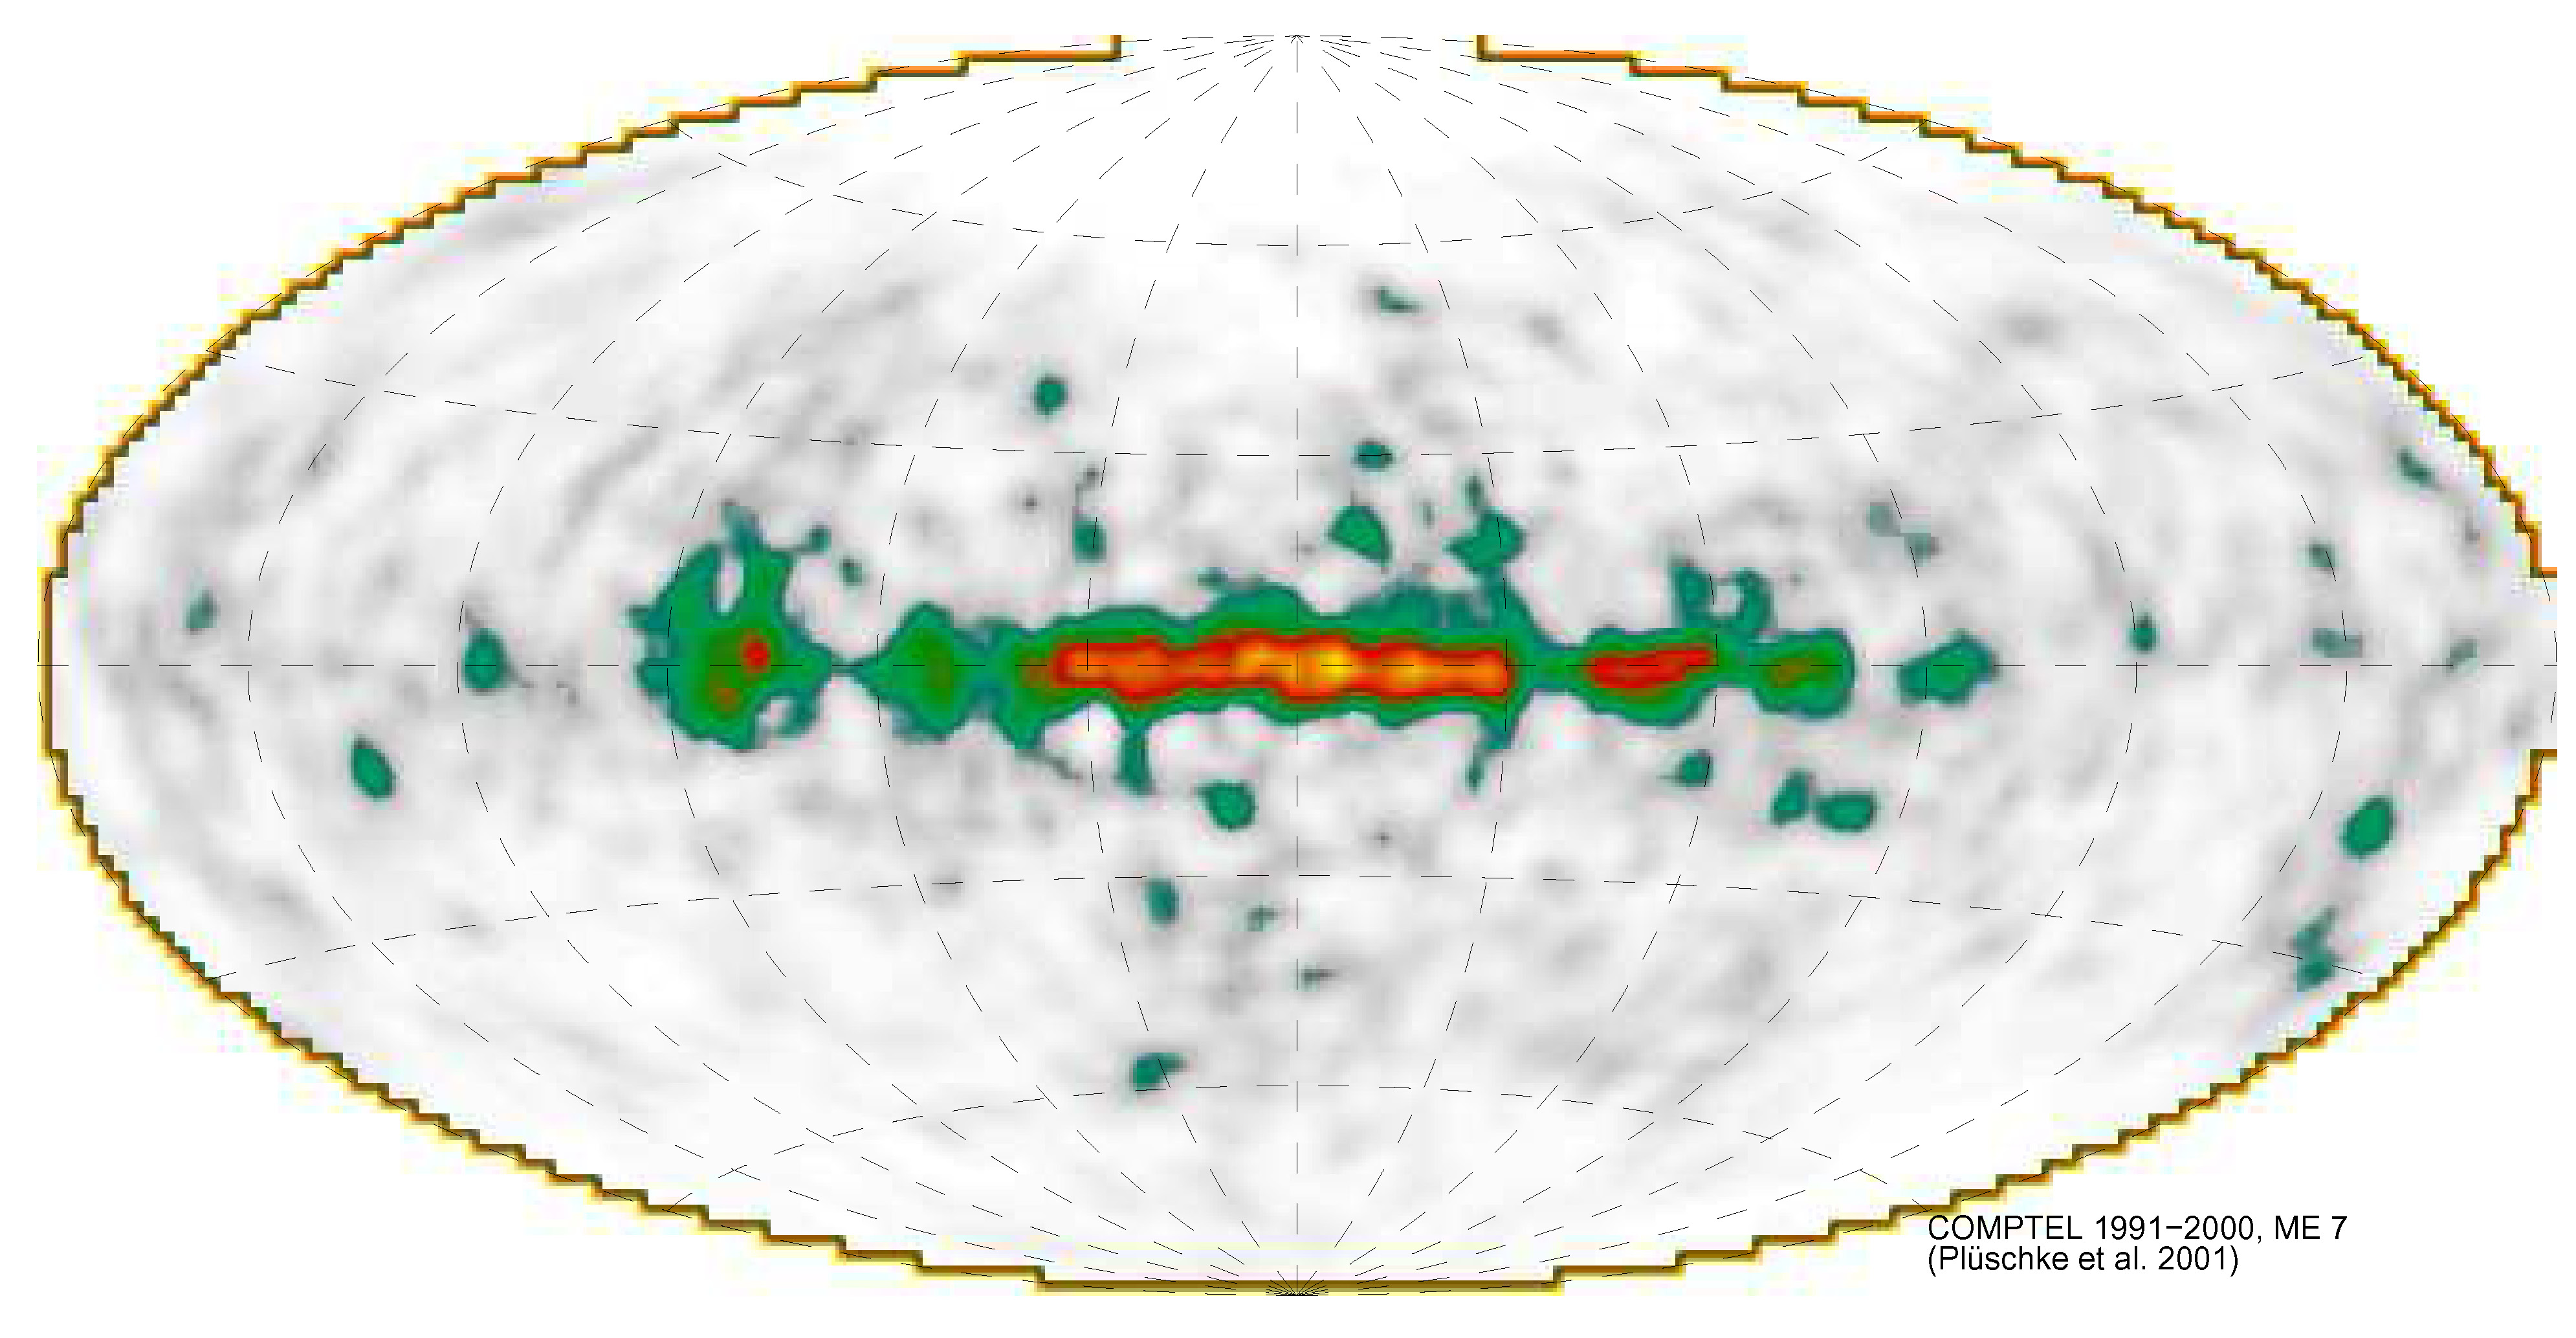
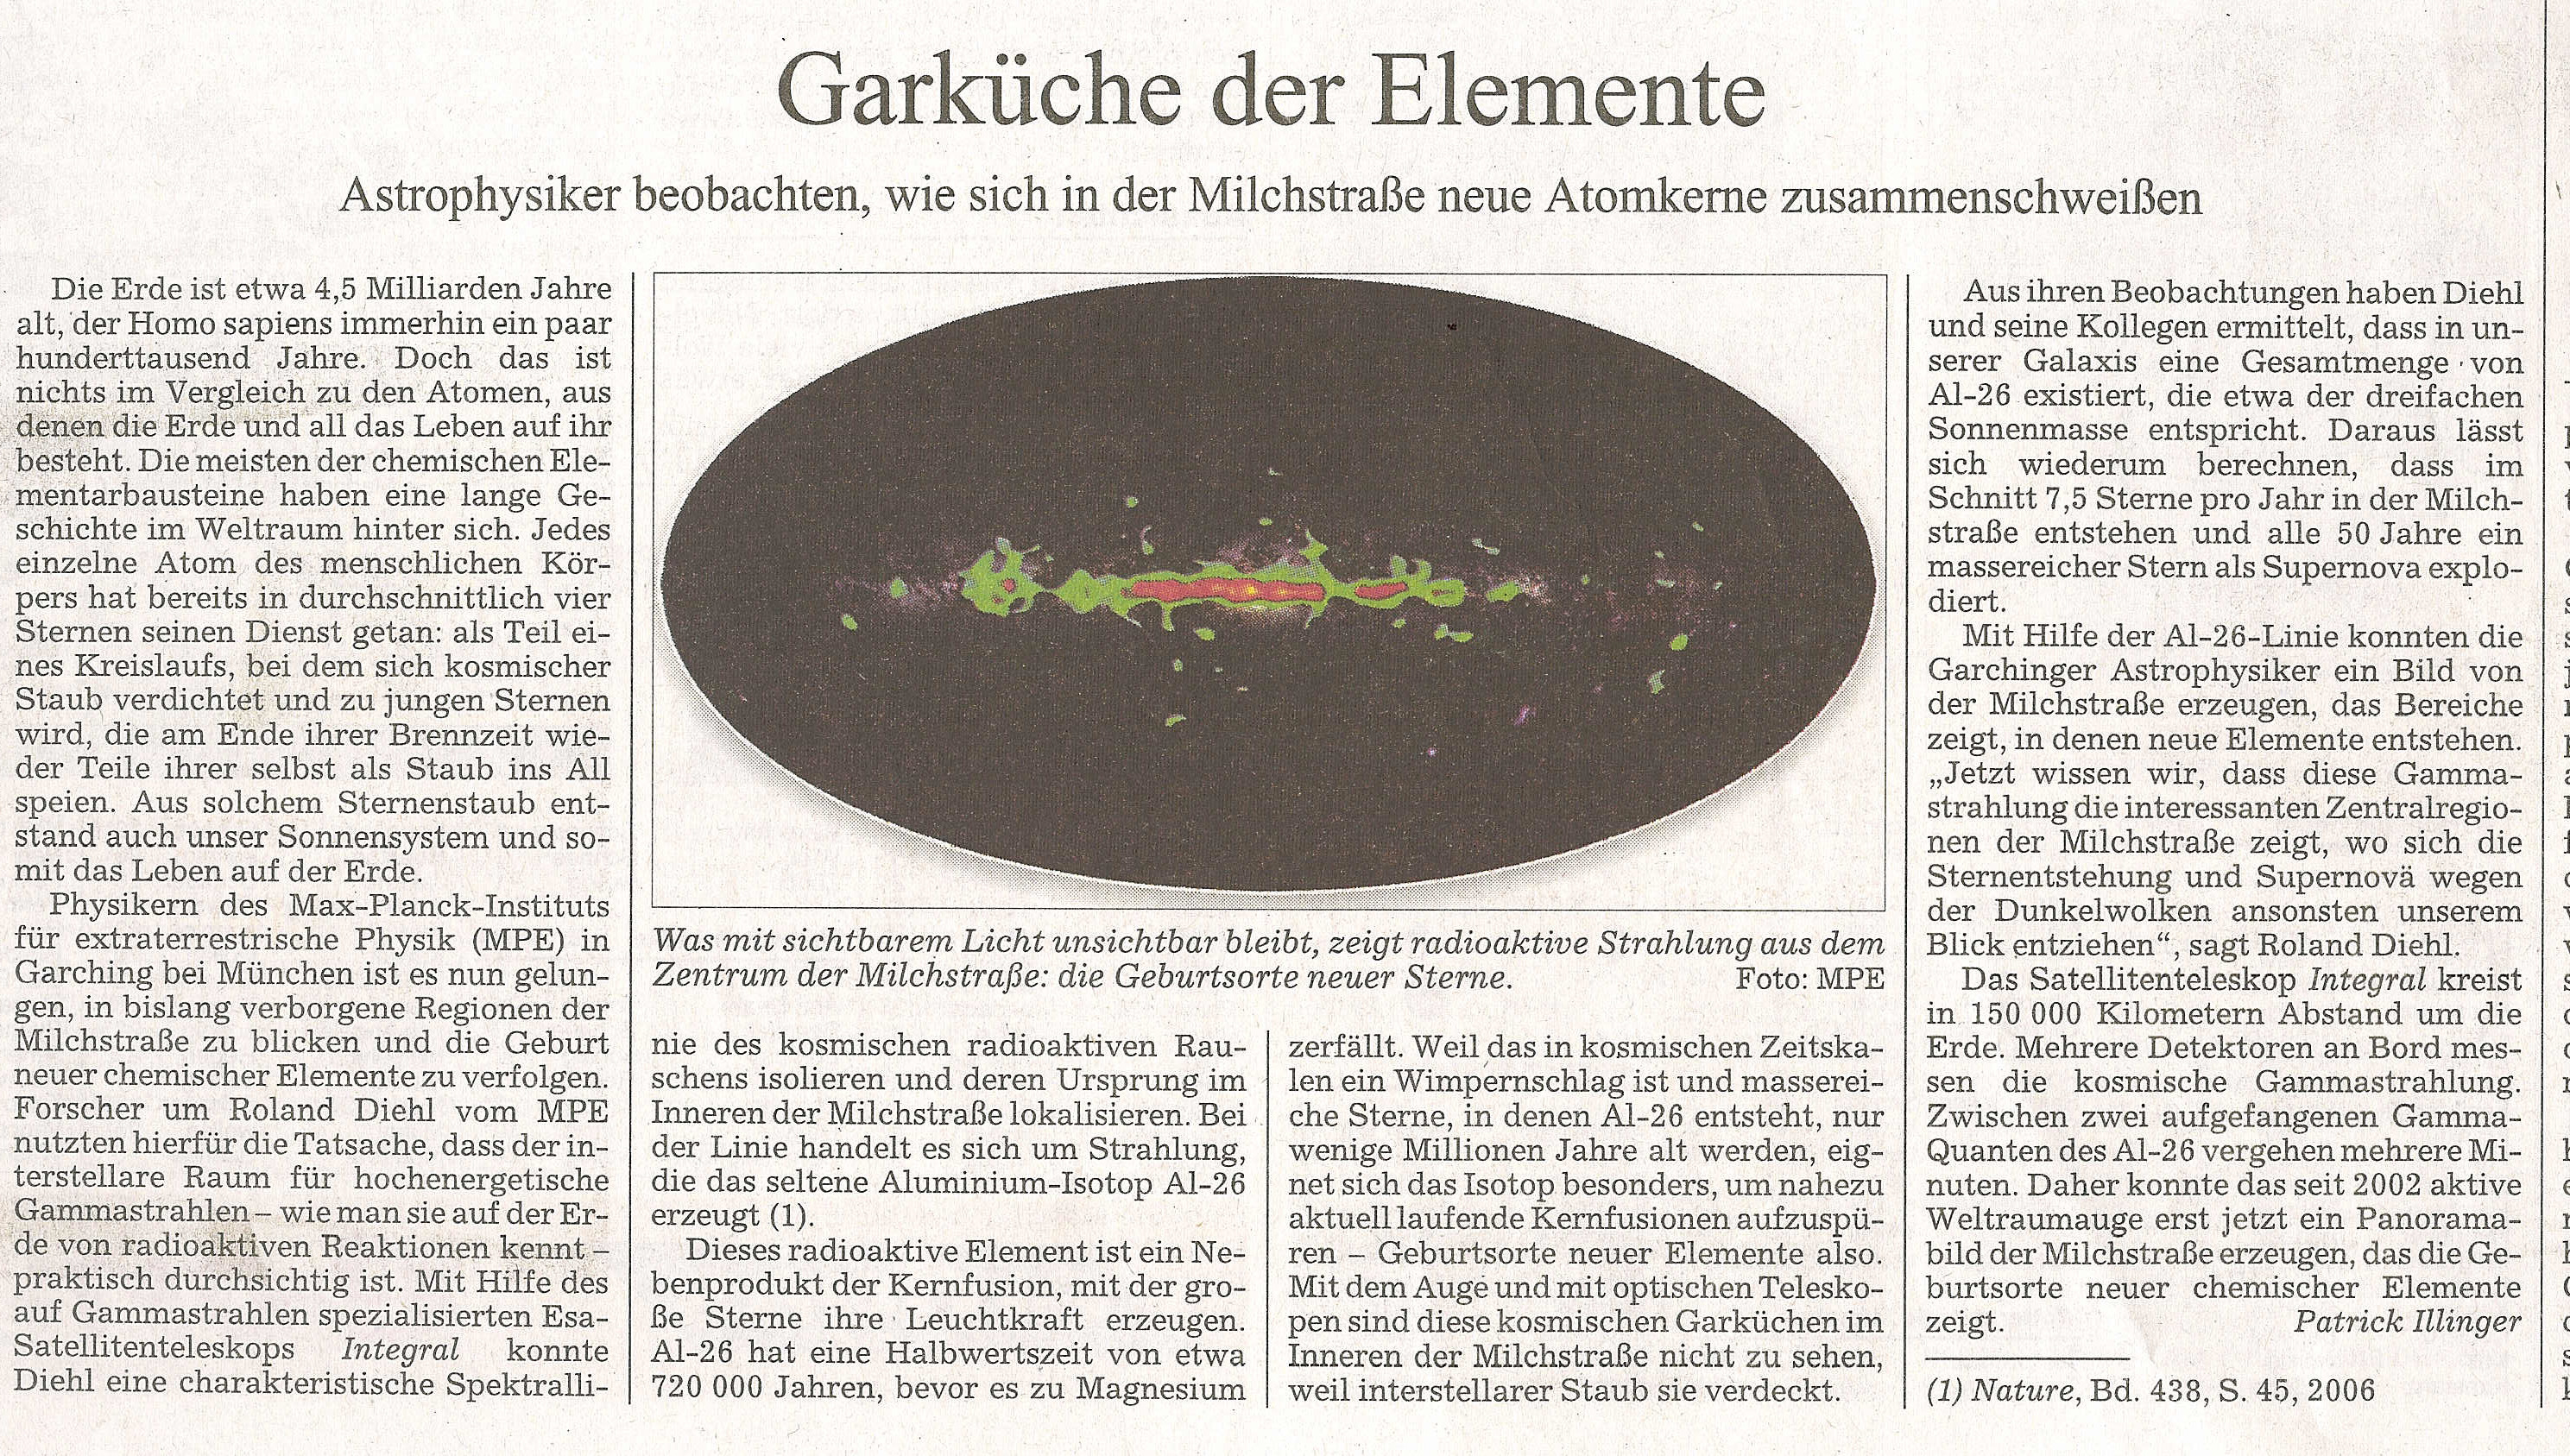
Variations along the Plane of the GalaxyUsing the imaging spectrometer on ESA’s Gamma-Ray Observatory INTEGRAL, measurements of the gamma-ray line from radioactive decay of 26Al (T1/2~720000 years) can now be distinguished from different regions which host young stars in the Galaxy.
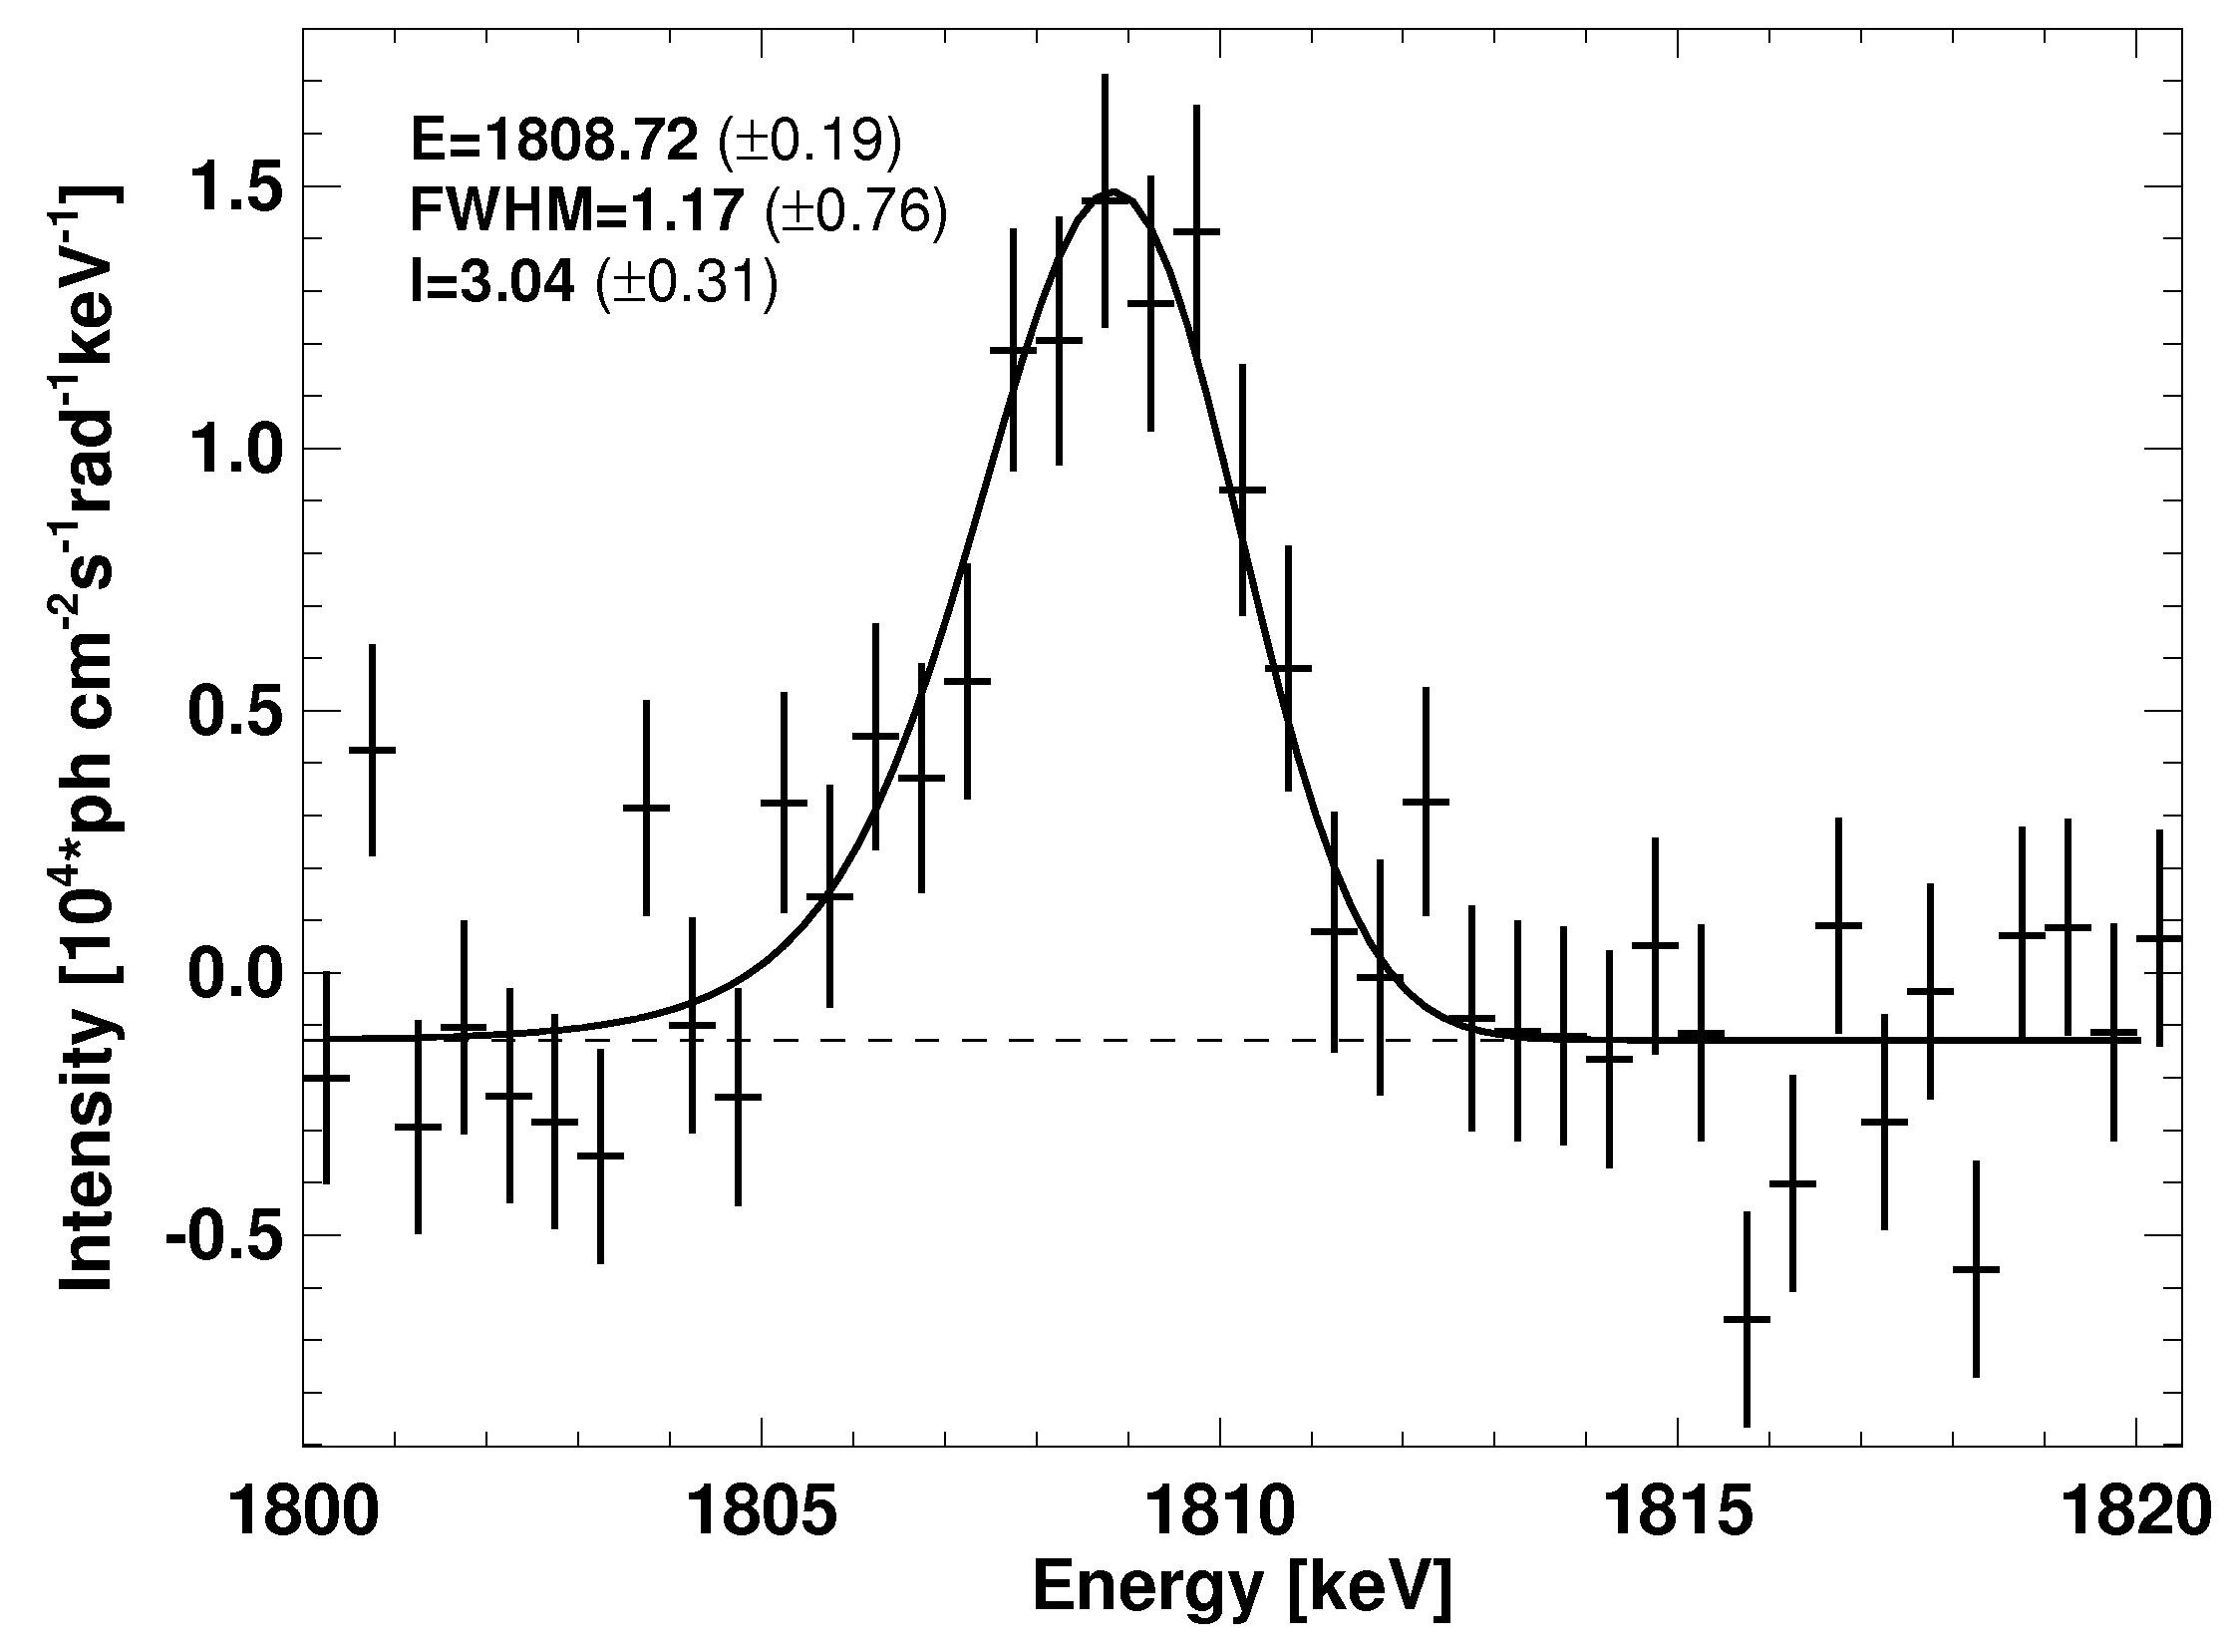
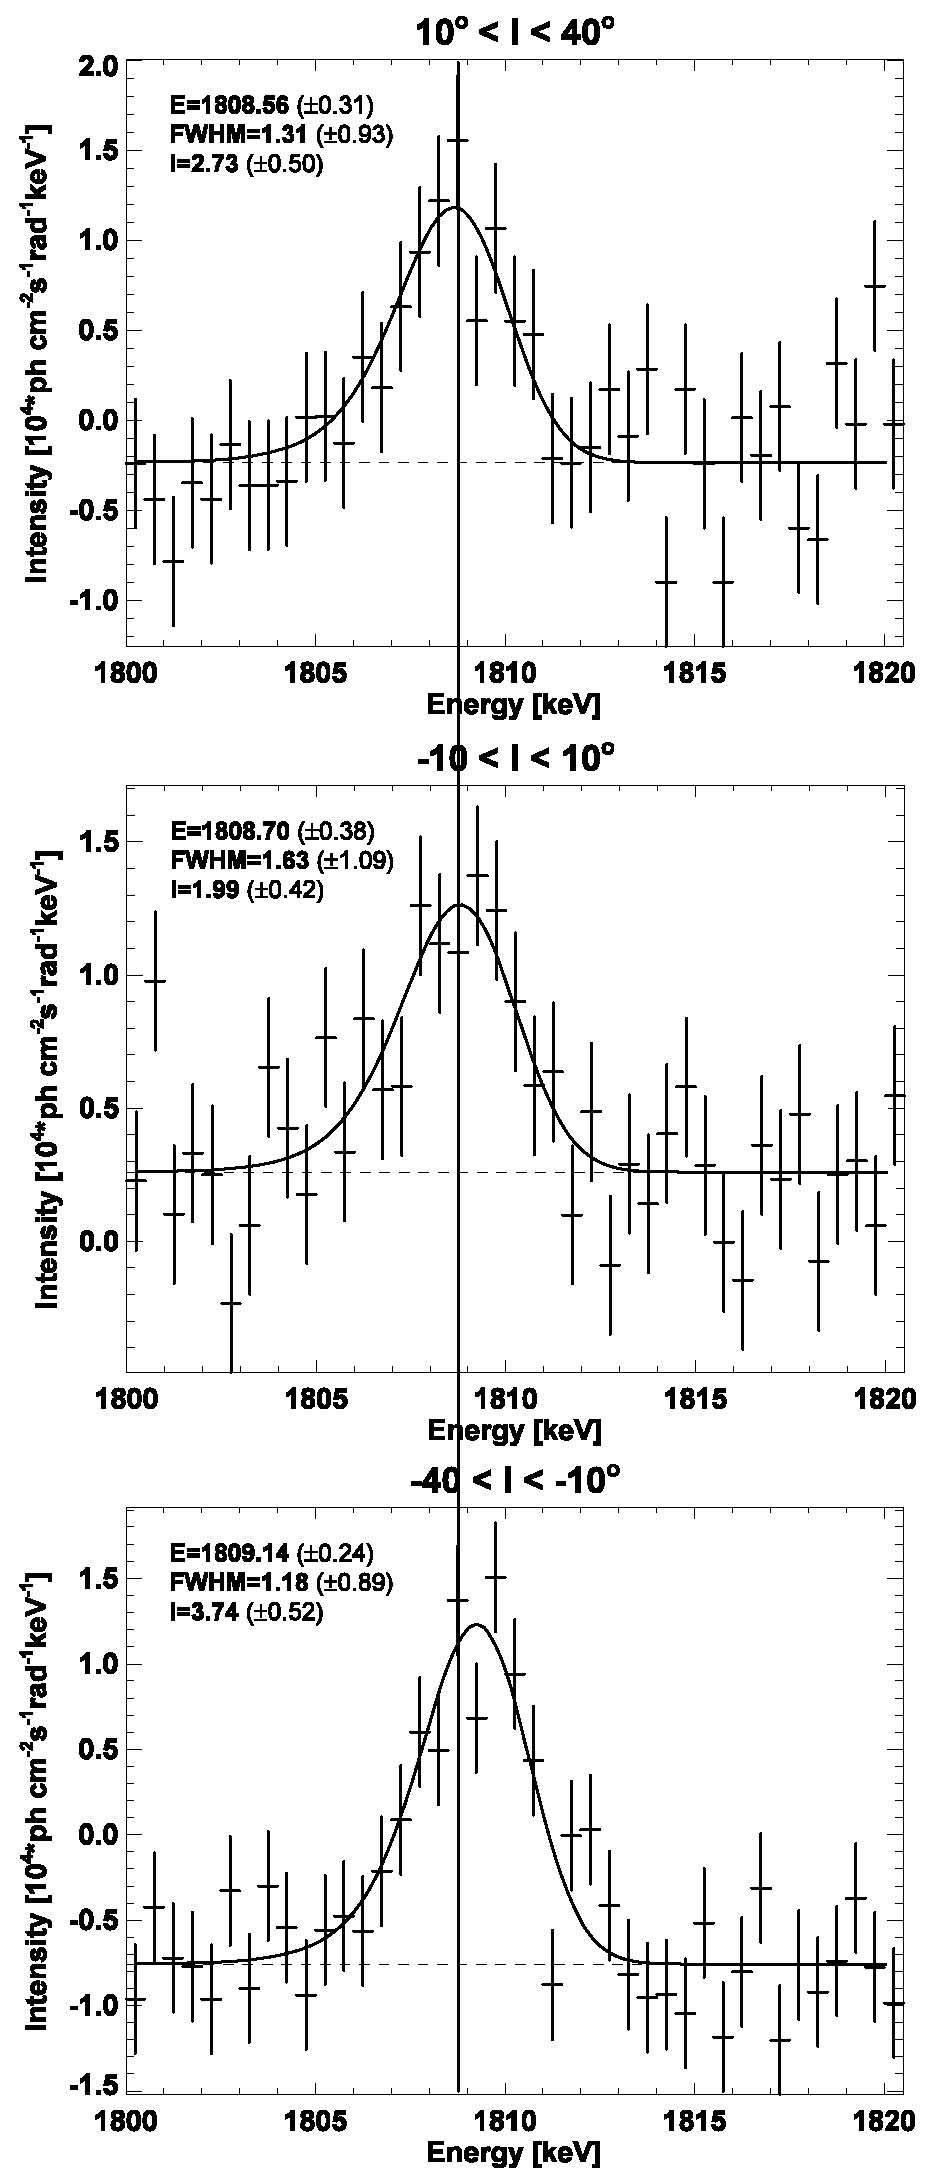
This spatially-resolved spectroscopy shows that the line centroid indeed traces the bulk motion imposed by large-scale rotation within the Galaxy, and that the line in general is narrow. A suggested broadening in the Aquila region hints at recent young-star activity, possibly embedded within interstellar clouds and hence unnoticed in other tracers.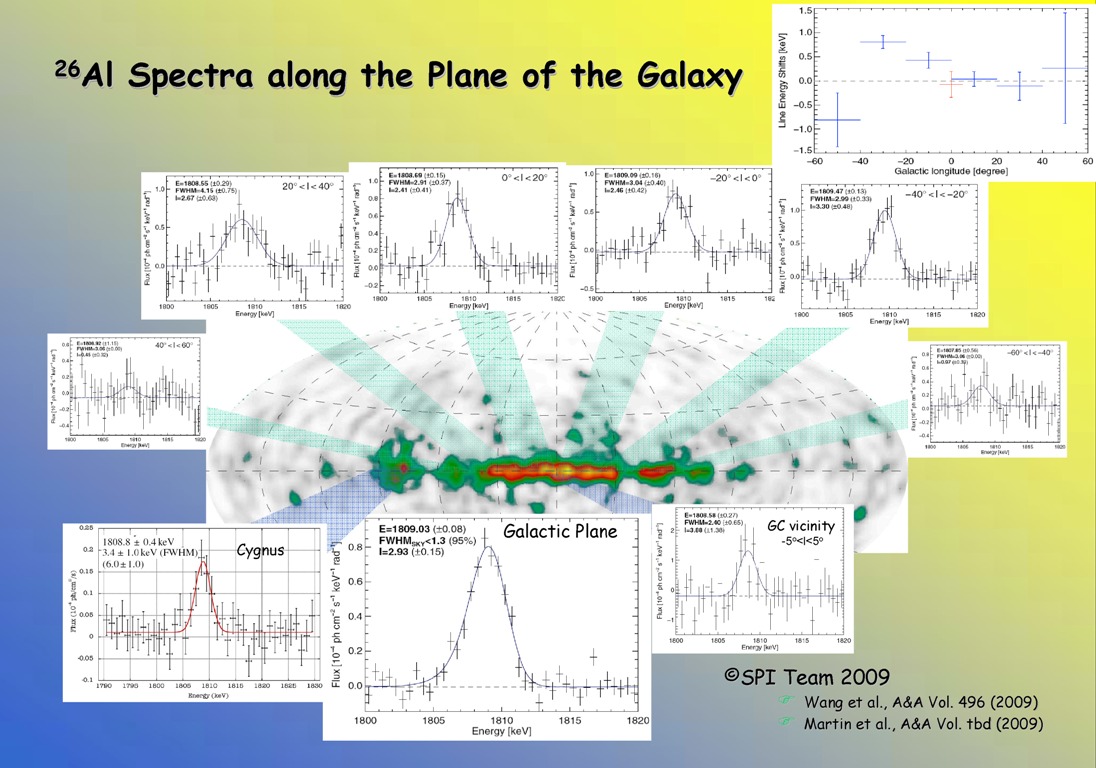
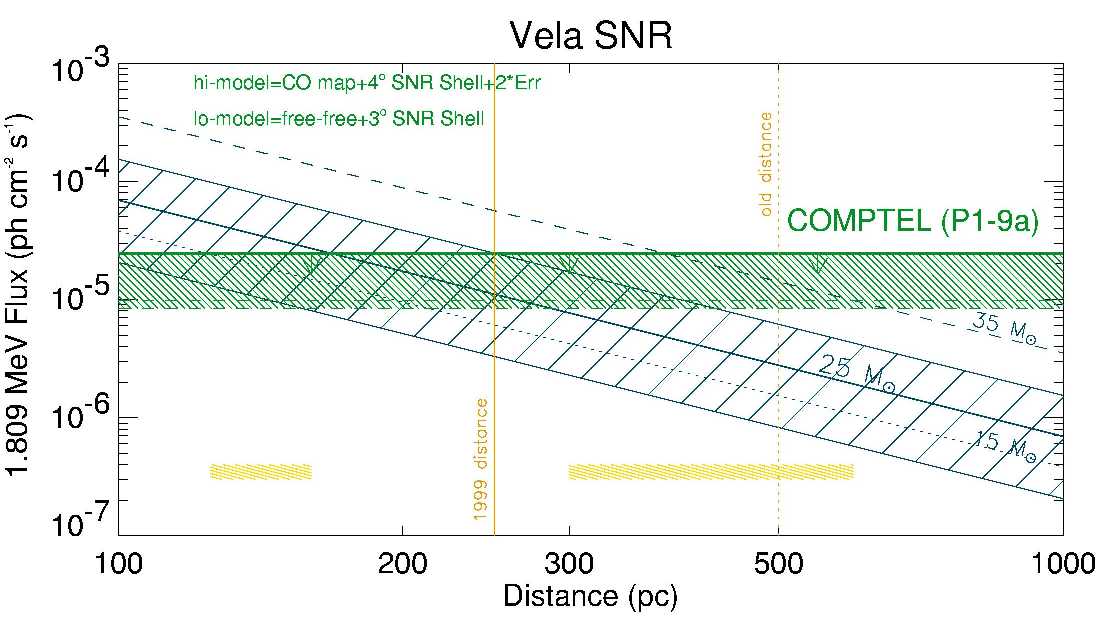
 Determining the Galactic
Supernova Rate through Radioactivity
Determining the Galactic
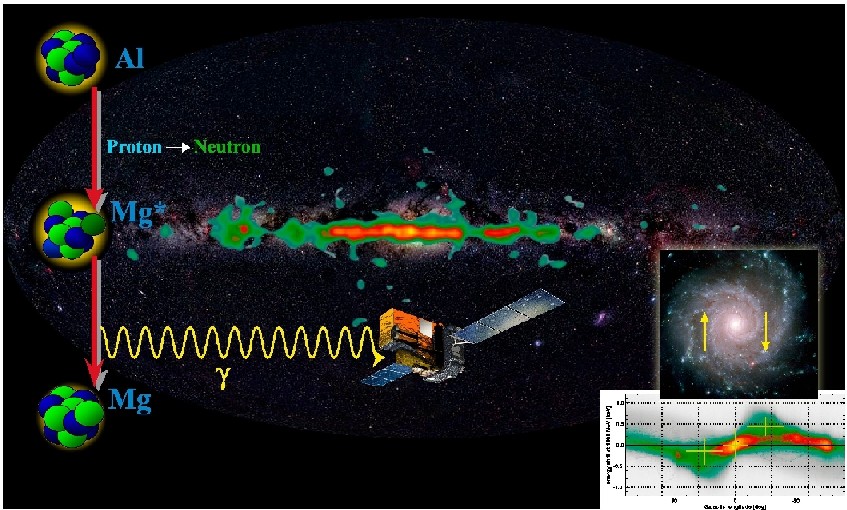
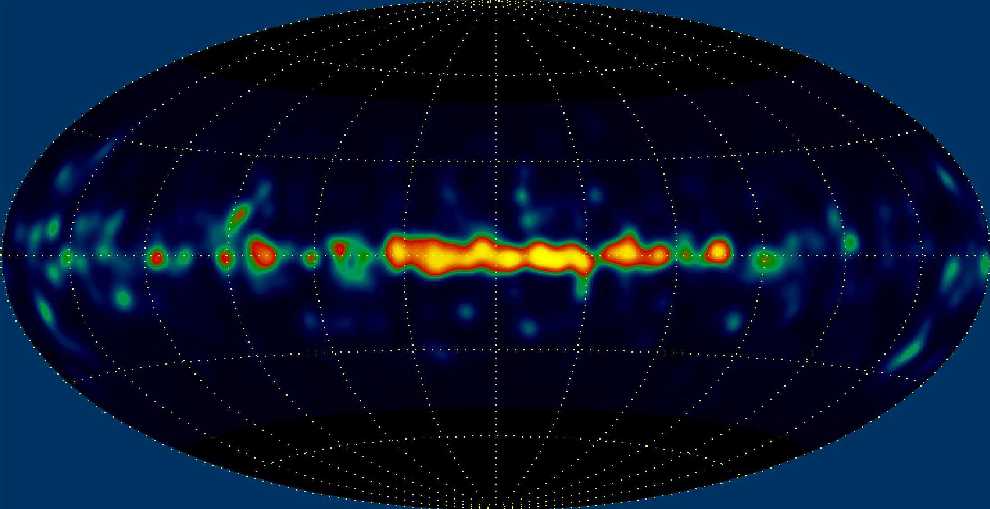
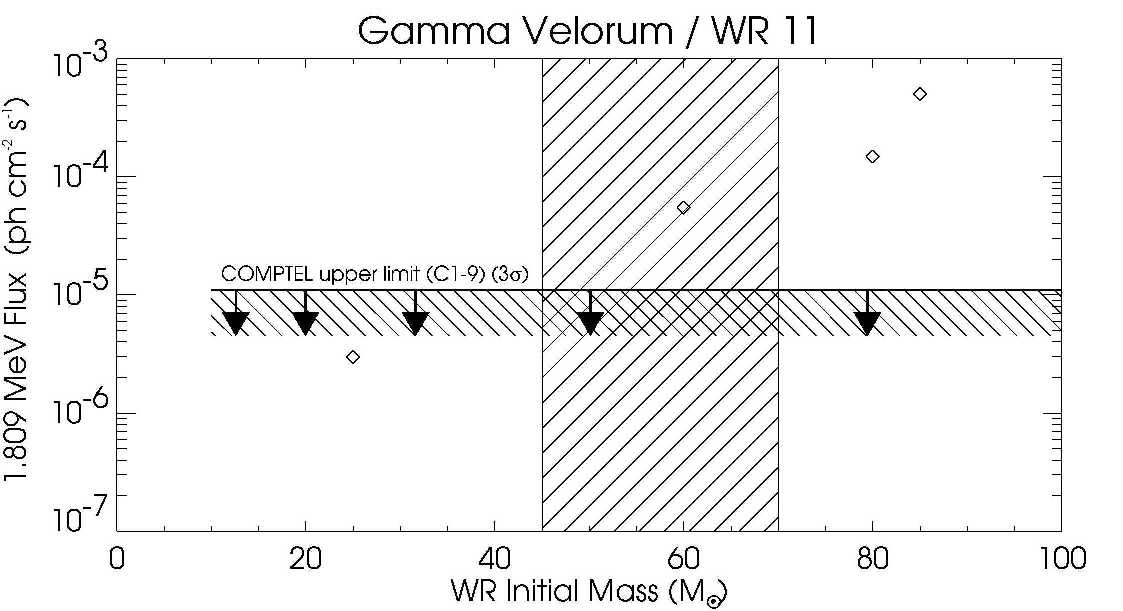
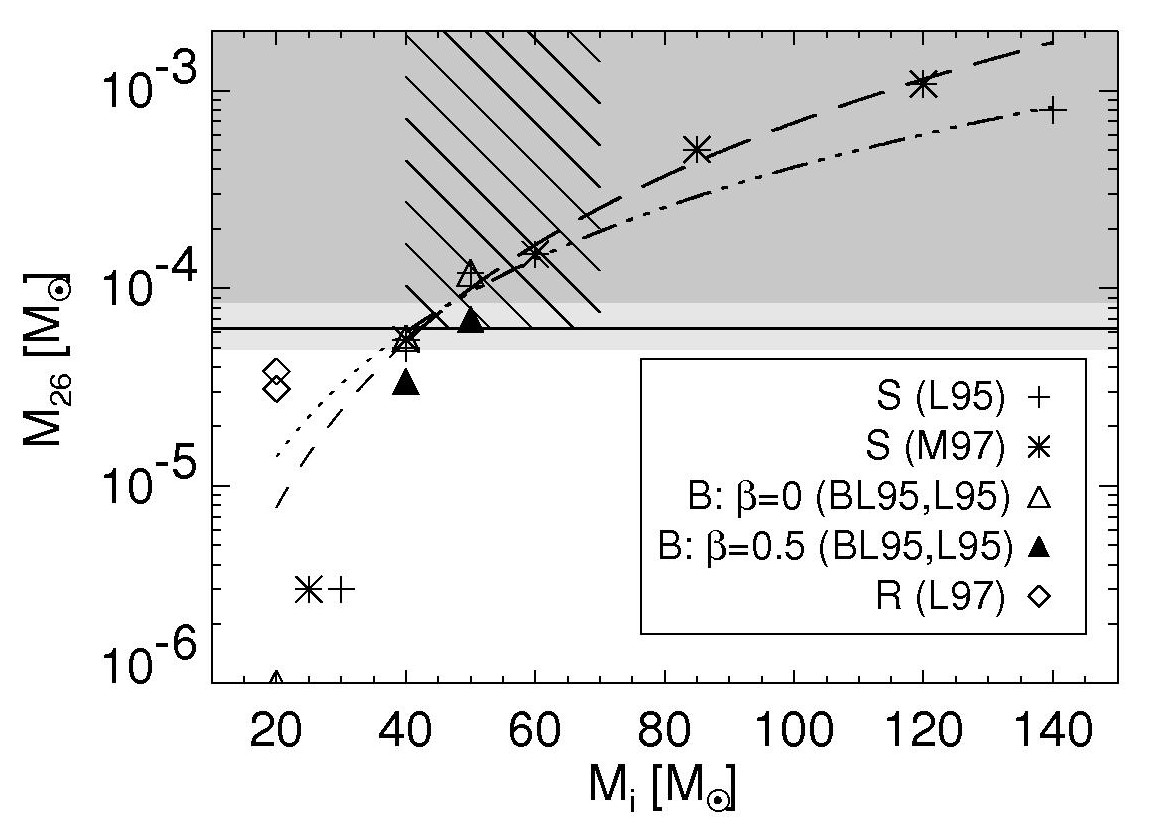
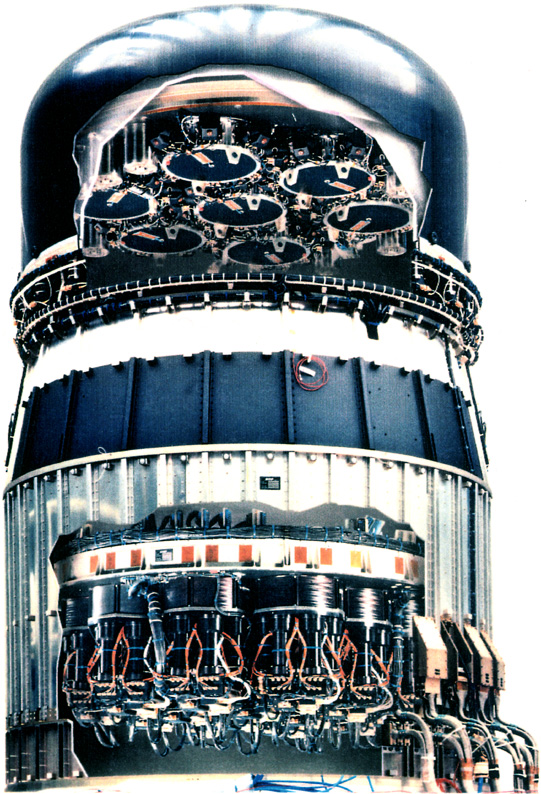
Supernova Rate through RadioactivityUsing the spectrometer on ESA’s Gamma-Ray Observatory INTEGRAL, a precision measurement of the gamma-ray line from radioactive decay of 26Al (T1/2~720000 years) demonstrates that this radioactivity reflects the entire population of massive, young stars in the Galaxy.
 pdf, jpg
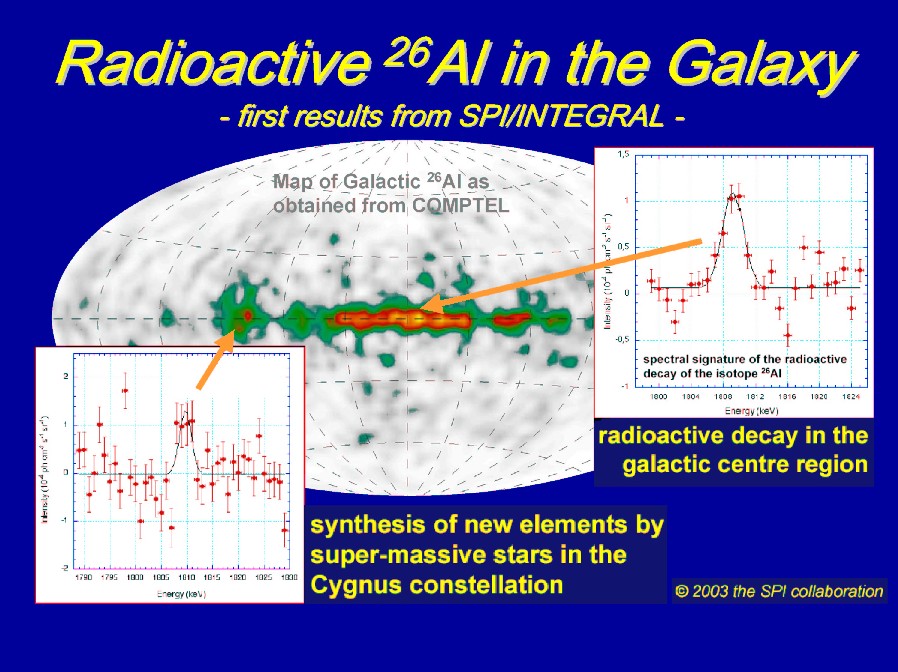 Jul 2003,
 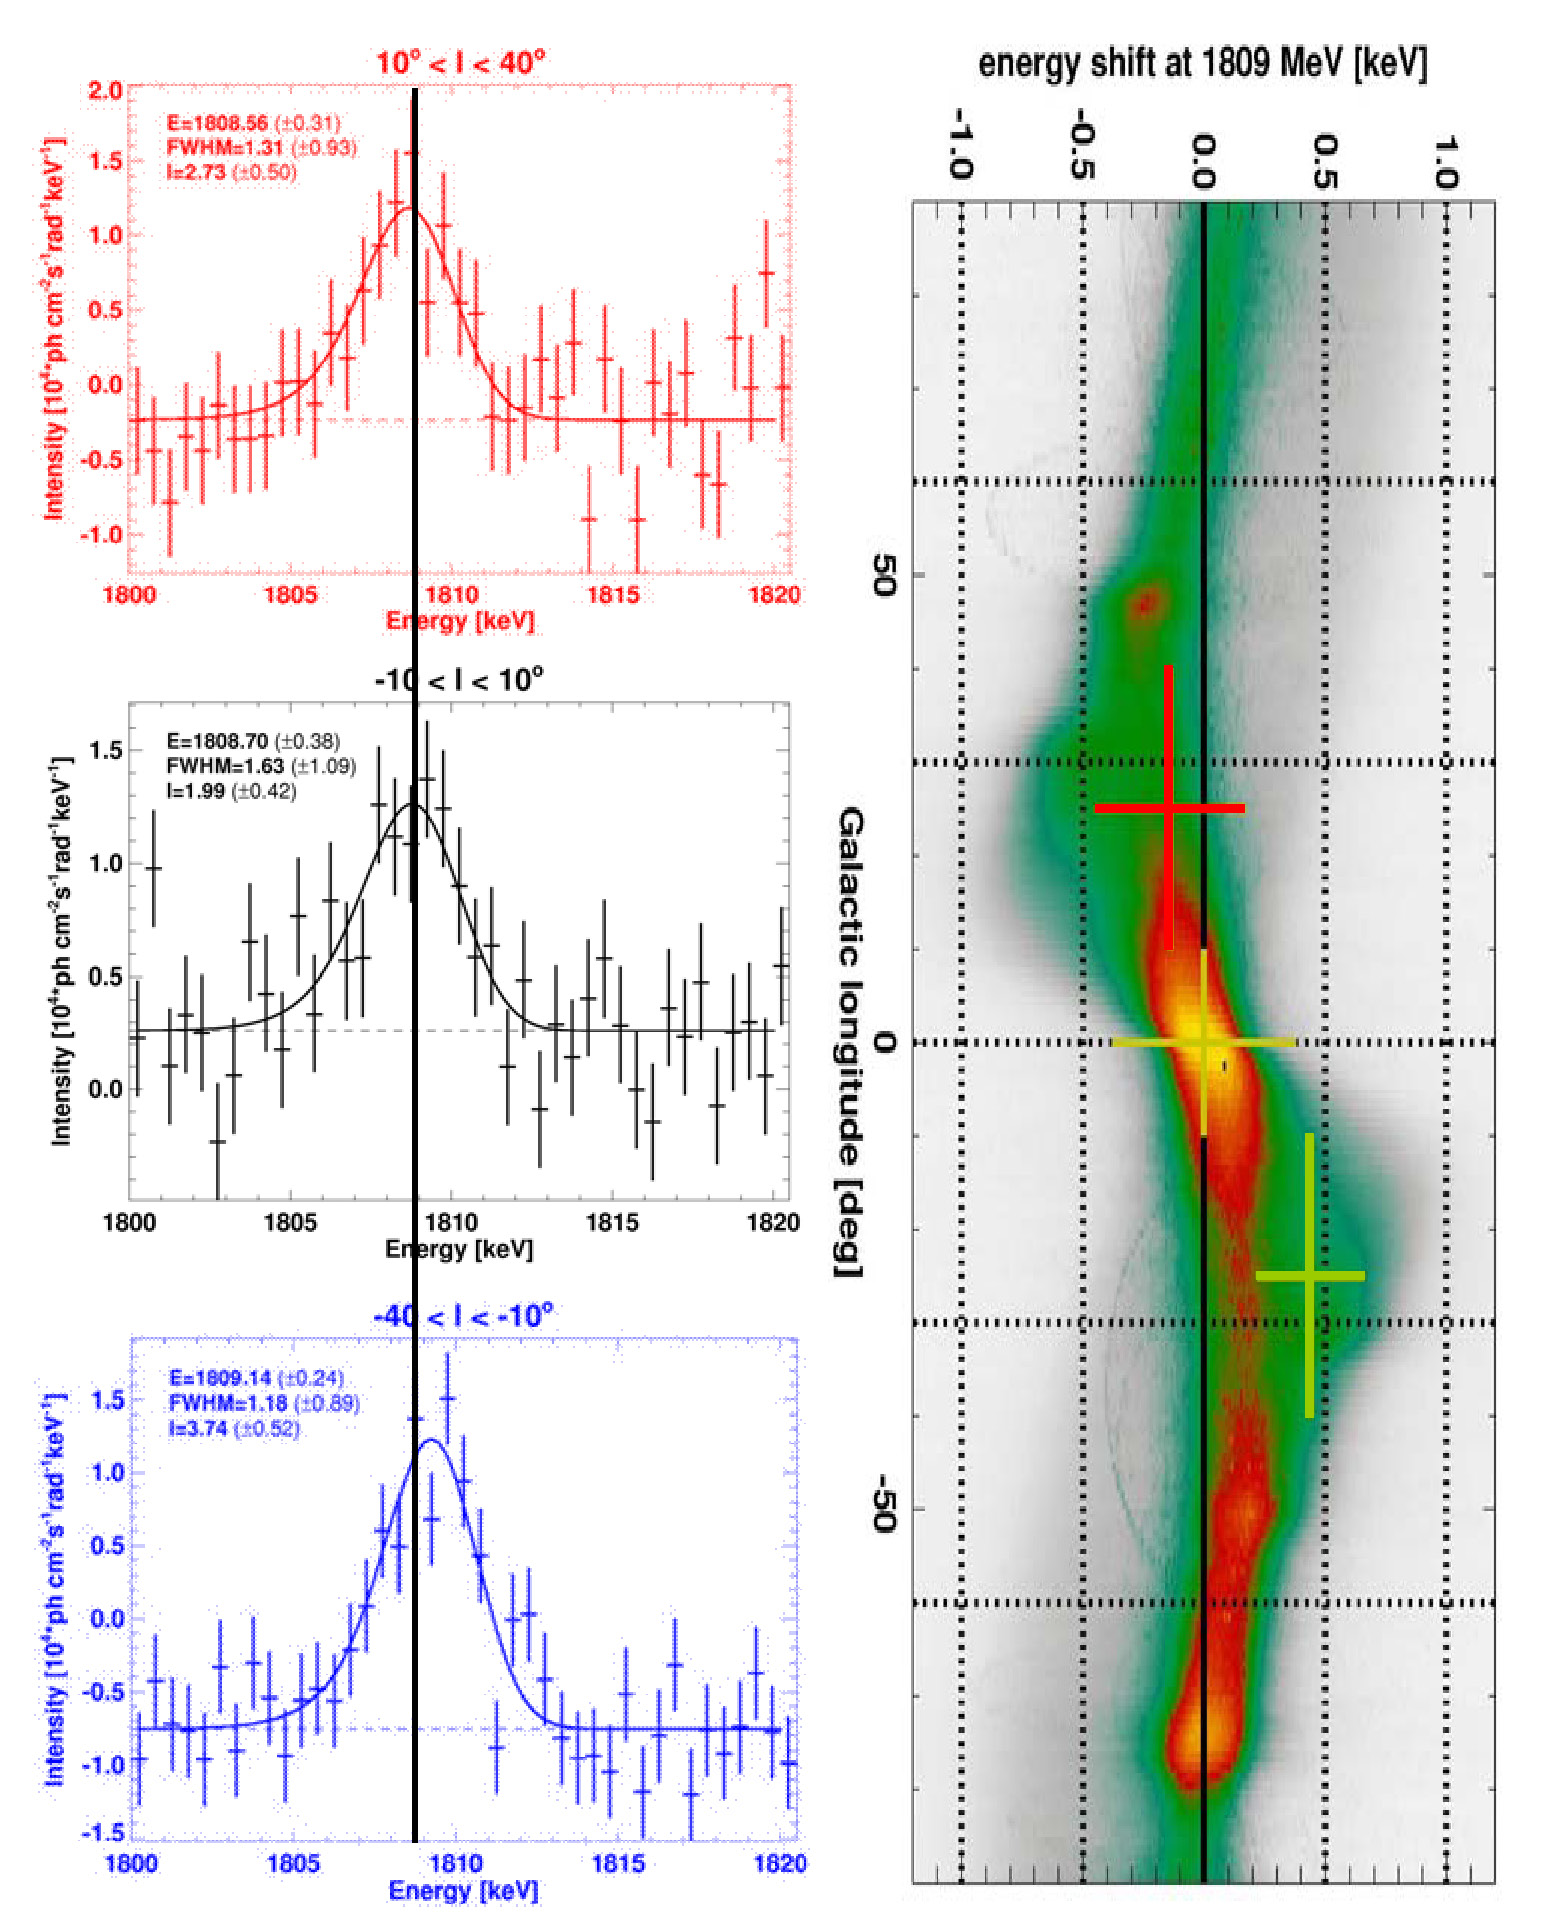 Jan 2006
  (... for education/overview; by Roland
Diehl; credits: MPE 2001)
(... for education/overview; by Roland
Diehl; credits: MPE 2001)
Spectroscopy Results

 (
(  (
( (
( (
( 