|
|

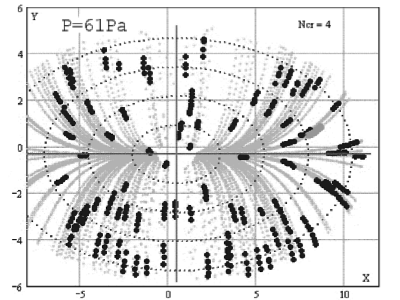
Forces and potential energy inside the voidA complex plasma is, under certain conditions, expected to build up a regular 3-D structure, a 'plasma crystal', that fills the whole volume of the plasma in microgravity. But most experiments with PKE-Nefedov aboard the ISS showed an inhomogeneous filling of the plasma discharge space. The micro-particles are located around a particle-free zone in the center, the so-called 'void'.Often the void reaches a size half of the diameter of the whole discharge. This unexpected feature that prevents large undisturbed plasma crystals needs further investigation, also to learn more about the forces inside the plasma. In one dedicated experiment the plasma crystal was disturbed by a gas puff and particles were placed inside the void where they were expelled immediately. (See image on the right side.) From 198 trajectories (marked in the image) we can derive the effective potential acting on the particles inside the void. See the original data movie: AVI (4.4 MB). First observation: After the puff the void swings back and forth. But if we take into account this motion we get distorted trajectories! The particles move in the reference frame of the plasma chamber. This means the feature that causes the void is independent from the particle cloud. It acts with reference to the plasma chamber. From the particle trajectories we can derive the velocity of the particles. If we plot the x (=horizontal) and y velocity components separately depending on their x and y position we get the following graphs: 

The x and y components of the velocities are
proportional to the x and y position of
the particles and can be well fitted by straight lines.
The slopes of the lines gives us the spatial accelerations
ax = 0.308 s-1
horizontally and ay = 0.711 s-1 vertically.
These relations will be useful in the following way: Let's start
with the equation of motion of a particle inside the plasma (left
panel, top):


where m is the particle mass, R the gas
friction coefficient and Phi the potential at the position
xi (=x,y). We get, after integration
and substituting xi' with the relation
vi(xi)
= ai xi found above,
the equation at the bottom of the left panel.
With the experimental parameters m = 3.1x10⁻¹⁴ kg and R = 1.18x10⁻¹¹ kg/s (Epstein-Drag of particles with d = 3.4 µm in Argon at p = 97 Pa) (right panel) and choosing Phi0 = 0 we get the separated components of the effective potential:
Phix(x) = -1.14x10⁷
eV/m2 x2 and
Phiy(y) = -2.36x10⁷
eV/m2 y2
which is clearly a parabolic dependency of the potential
energy of the particles on their distance from the center.
If we plot these parabolas within the limits
of the void boundary in each component (see left plot below) we
find the potential energy to be in the same range. This implies the
void boundary is a equi-potential line (or surface in 3-D).


The image above, right side, shows a simulation of the particle trajectories
under the assumption that the force acting on the particles inside the
void increases linearly with respect to the center. The resulting
parabolas fit very well the measured positions of the trajectories
(black dots). This implies that the force responsible for the void
formation can be assumed to be the drag force of the ions produced in
the center of the discharge streaming out towards the electrodes.
Another example of the necessity of microgravity experiments, since on earth the ion drag force is covered by the force of gravity which exceeds the ion drag by an order of a magnitude. Conclusions:By placing particles inside the - usually particle-free - void and analysing the trajectories we gain valuable information about the conditions inside the void.
Publication: M. Kretschmer, et al., IEEE Trans. Plasma Science, Vol. 39, No. 11, 2758 (2011) Next: PKE-Nefedov Concluding Report |
|
|